With a “tiny bit” of delay, I’m releasing the slides for my Graphite presentation. I don’t know why I didn’t post them here, if they already were in LinkedIn…
Anyway, there you go:
With a “tiny bit” of delay, I’m releasing the slides for my Graphite presentation. I don’t know why I didn’t post them here, if they already were in LinkedIn…
Anyway, there you go:
These are the slides of the Cassandra presentation I did in Barcelona Cassandra Users Meetup last week. Feel free to criticize, comment or correct them!
Since we started working with Cassandra I’ve noted down all the mistakes we made due to our inexperience with the application, so we don’t repeat them again. I didn’t talk about them much because I was really ashamed for some of them 😀 But recently I’ve seen a video talking about frequent mistakes with Cassandra, and almost all our mistakes were there! If only this video had existed when I started… *sigh* But hey, now that I’ve seen we are not dumb, because being wrong is part of learning Cassandra, I am not ashamed anymore, and I’ll explain all the mistakes, just to help out anybody starting with cassandra right now. Here we go!
These systems solve inexistent problems, because Cassandra is developed to be fault tolerant within its nodes. Of course we can add another high availability layer with SAN or RAID, but it will be more expensive and perform worse than adding more Cassandra nodes. Besides, with SAN, if all our nodes write to the cabinet, we’re adding a Single Point of Failure that we had not before. Plus, Cassandra data is written to several servers at the same time, and this triggers internal processes (like compactions) at the same time. Cassandra tries to get the maximum I/O assuming disks are local (which is normal), and the result is all the servers squeezing the SAN at the same time, bringing I/O performance down (thus, our cluster performance). Our performance with a SAN will not improve, and probably will get worse, and with a high cost. Obviously you can use a cabinet powerful enough to stand this load, but with half the money you can improve cassandra “the Cassandra way”: using local discs and, if we want RAID, make it RAID0. Cassandra already is fault tolerant, let Cassandra do its work for itself.
At first it seems a good idea: we guarantee an even load and, if a node goes down, the load balancer will tag it and won’t send any more connections until it comes back. This is already working in our webservers, and does a good job, right? ERROR!! The same issue as before: This problem doesn’t exist in Cassandra. Data is evenly distributed along the nodes, and the high level clients (such as Hector, Astyanax or pycassa) already send queries evenly, and tag the dead nodes. Plus, adding a load balancer we are adding a Single Point of failure to the system, where we didn’t have any, we are using more resources and making the architecture more expensive. We can even have our load balancer being he bottleneck in our system, bringing us more problems where there were none. Cassandra already balance the load, let Cassandra do its work for itself.
The CommitLog is written sequentially all the time. If the SSTables are being read in the same disk (these are random reads), each read will affect the CommitLog writes, because we will loose sequenciality, the disk will make seeks, and will slow down the writing process (keep in mind that write speed in Cassandra is limited by CommitLog writes, because the rest is written to RAM). The CommitLog doesn’t need much disk space, but it’s painfully affected by the seek time. In our jobs, we disregarded it, thinking it would make no difference to have it separate… but testing our cluster, where the nodes had loadavg of 7-7.5, we decreased to 4.5-5 just changing that. Our face? Open mouth at first, and facepalm afterwards. Obviously this does not apply to SSD disks where there is no seek time.
What’s happening in this server where snapshots take more time than the others? Why the loadavg in this server is higher? Check out your puppet manifests, because it’s 99% probability you forgot to put the JNA library. The JNA (Java Native Access) allows the java virtual machine to interact with the filesystem in a native way through the operating system, not with java libraries that are slower and inefficient. This way, interacting with files is way faster, and you can see it specially when doing snapshots. Installation is very easy, and consequences of not installing it are serious.
Cassandra works with lots of sockets and open files (there are a lot of SSTables!), and 1024 (the default maximum in linux) runs out fast. Probably, while your are in a test or integration environment you will not notice it. And you may even start in the production environment with no problems. But while SSTables are written, the number of open files increases, and once you reach the limit, your node will go down in a nasty way, probably dragging the rest of the nodes with it. Don’t forget to add the limits.conf modification in your puppet manifest!!
You have a 64GB RAM server (you rock!!) and you think about giving Cassandra some of that memory, or have “OutOfMemory” errors every now and then, or you think GarbageCollection is running too often, or for whatever reason you think it’s a good idea to increase the RAM assigned to Heap, so you change cassandra-env.sh to increase javaHeap. But don’t forget GarbageCollection is a resource consuming process, and the cluster affectation grows exponentially along with the amount of memory to be freed. So, it’s recommended to assign 4-8GB for the javaHeap, and in some cases even more, up to 12GB, but only if we know what are we doing and are targetting something. You shouldn’t assign more than 16GB, never.
If you want to use this memory for your cluster, don’t bother, Cassandra will end up using it as OS page cache.
EBS disks in Amazon have an unreliable performance. Amazon sells them as they’re good, but actually the I/O is very variable, and we can have a long time with high disk latency killing our cluster. It’s better to use the EC2 ephemeral disks because they have a more reliable performance. Yes, if a node goes down or if we need to reboot it, we will loose data in the node and we will need to rebuild it… but we have the nodetool rebuild for that. And yes, if all the zone hosting our cluster goes down, we will need to start from scratch, and that’s very risky, but if you are using aws you are very likely storing snapshots of the servers and Cassandra data in Amazon S3, and restoring will be fast (Netflix’s Priam will help you to get the job done). More information about EBS.
And these are the mistakes we made. If you have read this BEFORE starting with cassandra, you just saved yourself some headaches! 😀
After the latest posts, we know how to install cassandra and tune it a little . But that’s not enough, because before putting it on a production environment we must be able to guarantee cassandra is working OK, and having alerts when it’s not. That’s why we should integrate it inside our monitoring system, being Nagios, Zabbix, Zenoss, Graphite… Now we will identify where should we watch inside our cassandra cluster to detect issues or problems right in our monitoring systems.
First of all we want to make sure the server has enough available resources, and then check if the service is started and listening. In a recent post we talked about a script monitoring the linux basics . To check if the process is running we can do a typical /etc/init.d/cassandra status if we installed the init.d script, or “ps uax|grep CassandraDaemon|grep -v grep” if we didn’t. To check if cassandra ports are listening, we can do a netstat locally for each one of them: 7000 for gossip (netstat -l –numeric-ports|grep “:7000 “) and 9160 for thrift (netstat -l –numeric-ports|grep “:9160 “) or the same with netcat (locally or remotely) nc -z -w 3
But cassandra is very big, and it has lots of configurable parameters, and it’s not easy to know why it fails when it fails. And also it would be great if we could foresee when something bad is about to happen, before it actually happens. For all that we want more data, useful data to help us in our diagnostics, to see what’s happening internally and to find which parameters could be tuned to improve the performance. We will find this data in cassandra’s JMX console..
There are different ways to connect to this console. Typically we can use jconsole, anddatastax offers opscenter, but as we said, normally we want this data consolidated in our own monitoring system. There are some bridges between jmx and other systems (munin, for instance, through https://github.com/tcurdt/jmx2munin, or snmp through https://github.com/tcurdt/jmx2snmp or appdynamics). I was interested in graphite, so I needed to access this data from the console. With nodetool I could do some things (tpstats, cfstats, netstats, info, etc) but not all I wanted, and also the java calls were too heavy for my taste. Then I discovered mx4j, a bridge between jmx and HTTP, putting the data where our curl can reach it. Perfect! Exactly what I needed!
The installation is simple (http://wiki.apache.org/cassandra/Operations#Monitoring_with_MX4J), just download the jar, put it inside cassandra’s “lib” folder and restart. Usually as easy as:
wget "http://downloads.sourceforge.net/project/mx4j/MX4J%20Binary/3.0.2/mx4j-3.0.2.tar.gz"

tar zxf mx4j-3.0.2.tar.gz

mv mx4j-3.0.2/lib/mx4j-tools.jar /opt/cassandra/lib/

/etc/init.d/cassandra restart
Once cassandra has restarted, we can acess mx4j in port 8081 from our browser
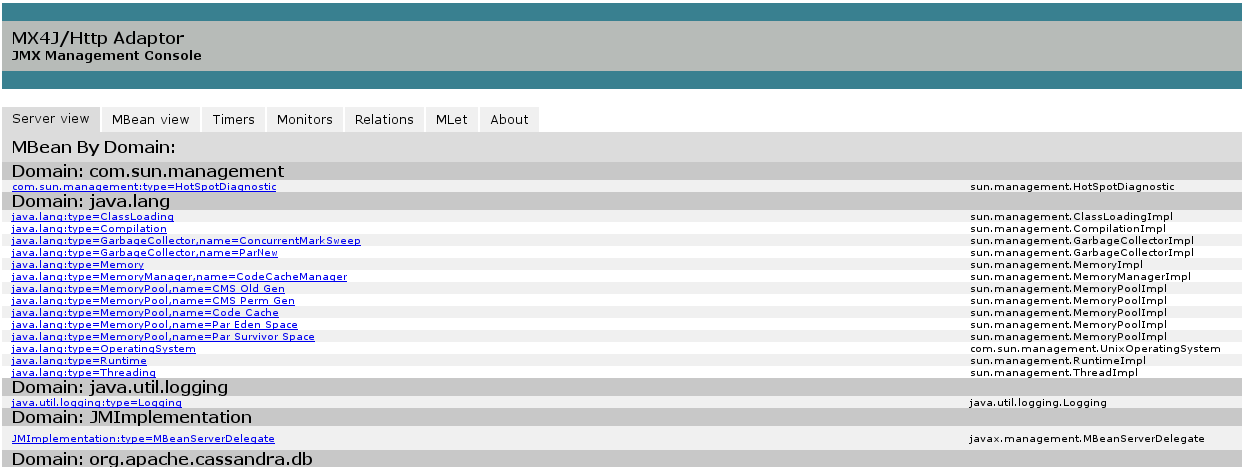
We will find there are TONS of data, and we don’t know the meaning of most of them (sorry, I’m not a java developer, there are quite a few things I don’t get :P). We have the description of most of the metrics inside cassandra documentation and from here we must choose which metrics are interesting. Reading some blogs (check the bibliography at the end of this post) I concluded the interesting data is:
With this metrics we can measure the activity in each server counting the number of operations. The three types are read, write and “gossip” (inter-node communication). We will gather the total CompletedTasks where we will see how many operations per minute are being executed, the ActiveTasks where we will see how many concurrent tasks are in each node, and the PendingTasks where we will see the “pending” queue length. With this data we can see a lot of things: for instance, if the number of PendingTasks grows consistently our node may be receiving more queries than it can handle, or maybe we ran out of disk space and, failing to write in the commitlog, they are piling up (anyway, if this metric grows, something wrong is happening). If we see the load in our server grows, but also CompletedTasks increases at the same time, this may be “normal”.
We can find these values at:
http://$host:8081/mbean?objectname=org.apache.cassandra.request%3Atype%3DReadStage
http://$host:8081/mbean?objectname=org.apache.cassandra.request%3Atype%3DMutationStage
http://$host:8081/mbean?objectname=org.apache.cassandra.internal%3Atype%3DGossipStage
Normally they are related to activity in cluster. If there are lots of writes, usually there will be compactions. We will gather how many compactions are pending (PendingTasks) and completed (CompletedTasks), so we know how many there are, and if they’re piling up. For instance, if we find a loaded server with a long compaction queue, we should think about putting down compaction priority (nodetool setcompactionthroughput 1), or if we see our queue grows consistently, we should think about disabling thrift (nodetool disablethrift) to stop receiving new queries, and giving max priority to compactions, to get rid of them the sooner the better (nodetool setcompactionthroughput 999). These metrics will also help us to know when a repair, or scrub/rebuild, or upgradesstables, etc. ended (although there is now a progress indicator for repairs, since v1.1.9 and 1.2.2). Anyway, if these values are usually not zero, we will have worries. The link:
http://$host:8081/mbean?objectname=org.apache.cassandra.db%3Atype%3DCompactionManager
Here we will get the latency in operations. We want this value to be the lowest possible, and if it grows without reason we should find out why. We have 3 latency types, one for each operation: Range (RecentRangeLatencyMicros), Read (RecentReadLatencyMicros) and Write (RecentWriteLatencyMicros).
http://$host:8081/mbean?objectname=org.apache.cassandra.db%3Atype%3DStorageProxy
Here we will find how much memory is available for Java, and how much of it is busy. We will get HeapMemoryUsage and NoHeapMemoryUsage.
http://$host:8081/mbean?objectname=java.lang%3Atype%3DMemory -s
Here we will gather GarbageCollections in the system. This is related to the former metric (JavaHeap), because each GarbageCollection will free some memory. This will help us when the java process is GarbageCollecting too often and ends up wasting more time doing so than in its main task (read and write data!). We should check the GC frequency (ConcurrentMarkSweep). If it’s too often, we may need to add some more memory to the java process. Anyway, we want this value to be the lowest possible.
http://$host:8081/mbean?objectname=java.lang%3Atype%3DGarbageCollector%2Cname%3DConcurrentMarkSweep
Outside JMX there are also interesting things
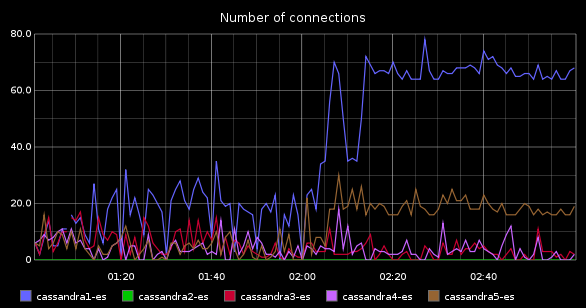
We want to know how many concurrent connections is Cassandra serving. This way, if cassandra load increases, we can correlate it to a users increase. If the number of users in our application doesn’t grow but cassandra connections do, something is wrong (the queries are slower, for instance). If the number of cassandra connections increases, and so do the number of users in our application, then this is “normal” and we should improve Cassandra (assigning more resources, or tuning the configuration) to fix it. This is a very interesting metric. It could be better, though. It would be great if we could see what transactions are active in cassandra (as does mysql show processlist) so we could see if there any badly constructed query or any that can be improved. But given cassandra’s architecture, this doesn’t seem feasible, so we will settle with the number of connections. I asked in cassandra-users mailing list if there is any way to get this number and they answered there is not such thing, but the find it interesting because it was frequently asked, so a developer ticket was created. Some day it will be implemented, I hope, and we will get his value from JMX. Meanwhile the only way is netstat:
connections=netstat -tn|grep ESTABLISHED|awk '{print $4}'|grep 9160|wc -l
To further squeeze Cassandra it’s also interesting to analyze each ColumnFamily Data. This way we can see size, activity, cache sucess rate, secondary indexes, etc. But these are lots of queries to mx4j (about 21 for each ColumnFamily, about 2000 HTTP queries in my case!), and this information doesn’t change so often, so I won’t gather it at the moment, and when I do it, I’ll get in 5-minutes interval, or 15 minutes, avoiding the server overload, so I’ll put that in a separate script.
And those are the interesting things we should monitor in cassandra. To gather this information I did a shell script. You can find it at my github profile, listed as cassandra-monitoring. It will get this information from mx4j in the servers (all but the established connections, this will come with netstat) and put it in a text string(“data“) to be sent later to graphite.
Here you have it:
#!/bin/bash
# WARNING - ATENCIO
# This script requires mx4j to be installed on cassandra monitored nodes. For more instructions visit:
# Aquest script necessita que el mx4j estigui instal·lat als nodes monitoritzats. Per mes instruccions visita:
# http://wiki.apache.org/cassandra/Operations#Monitoring_with_MX4J
#Carbon server where data should be stored for graphite to show - El servidor carbon on s'han de guardar les dades que mostra el graphite
carbon_server=graphite.domain.tld
# Tree structure where we want information to be stored - L'estructura de l'arbre on volem que es guardin les dades a graphite.
tree=servers
now=date +%s
host=${1:-localhost}
#Number of connections - Numero de connexions
if [ $host == "localhost" ];then
connections=netstat -tn|grep ESTABLISHED|awk '{print $4}'|grep 9160|wc -l
else
connections=ssh $host netstat -tn|grep ESTABLISHED|awk '{print $4}'|grep 9160|wc -l
fi
data="$tree.$host.cassandra.connections $connections $nown"
#Tasks in ReadStage - Tasques en ReadStage
data="$data curl http://$host:8081/mbean?objectname=org.apache.cassandra.request%3Atype%3DReadStage -s |egrep "CompletedTasks|PendingTasks|ActiveCount"|cut -d">" -f8|cut -d"<" -f1|awk -v tree=$tree -v now=$now -v host=$host '(NR == 1) {printf("%s.%s.cassandra.ReadStage.ActiveCount %s %s\n",tree, host, $0, now)} (NR == 2) {printf("%s.%s.cassandra.ReadStage.CompletedTasks %s %s\n",tree, host, $0, now)} (NR ==3) {printf("%s.%s.cassandra.ReadStage.PendingTasks %s %s\n",tree, host, $0, now)}'"
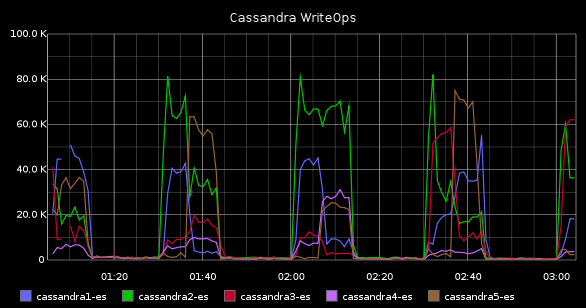
#Tasks in MutationStage - Tasques en MutationStage (writes)
data="$data curl http://$host:8081/mbean?objectname=org.apache.cassandra.request%3Atype%3DMutationStage -s |egrep "CompletedTasks|PendingTasks|ActiveCount"|cut -d">" -f8|cut -d"<" -f1|awk -v tree=$tree -v now=$now -v host=$host '(NR == 1) {printf("%s.%s.cassandra.MutationStage.ActiveCount %s %s\n",tree,host, $0, now)} (NR == 2) {printf("%s.%s.cassandra.MutationStage.CompletedTasks %s %s\n",tree,host, $0, now)} (NR ==3) {printf("%s.%s.cassandra.MutationStage.PendingTasks %s %s\n",tree, host, $0, now)}'"
#Tasks in GossipStage - Tasques en GossipStage (comunicacio interna entre cassandras)
data="$data curl http://$host:8081/mbean?objectname=org.apache.cassandra.internal%3Atype%3DGossipStage -s |egrep "CompletedTasks|PendingTasks|ActiveCount"|cut -d">" -f8|cut -d"<" -f1|awk -v tree=$tree -v now=$now -v host=$host '(NR == 1) {printf("%s.%s.cassandra.GossipStage.ActiveCount %s %s\n",tree, host, $0, now)} (NR == 2) {printf("%s.%s.cassandra.GossipStage.CompletedTasks %s %s\n",tree, host, $0, now)} (NR ==3) {printf("%s.%s.cassandra.GossipStage.PendingTasks %s %s\n",tree, host, $0, now)}'"
#Compaction tasks - Tasques de compactacio
data="$data curl http://$host:8081/mbean?objectname=org.apache.cassandra.db%3Atype%3DCompactionManager -s|egrep "CompletedTasks|PendingTasks"|cut -d">" -f8|cut -d"<" -f1|awk -v tree=$tree -v now=$now -v host=$host '(NR == 1) {printf("%s.%s.cassandra.Compaction.CompletedTasks %s %s\n",tree, host, $0, now)} (NR == 2) {printf("%s.%s.cassandra.Compaction.PendingTasks %s %s\n",tree, host, $0, now)}'"
#Operation Latency - Latencia d'operacions
data="$data curl http://$host:8081/mbean?objectname=org.apache.cassandra.db%3Atype%3DStorageProxy -s |egrep "RecentRangeLatencyMicros|RecentReadLatencyMicros|RecentWriteLatencyMicros"|cut -d">" -f8|cut -d"<" -f1|awk -v tree=$tree -v now=$now -v host=$host '(NR == 1) {printf("%s.%s.cassandra.Latency.Range %s %s\n",tree, host, $0, now)} (NR == 2) {printf("%s.%s.cassandra.Latency.Read %s %s\n",tree,host, $0, now)} (NR ==3) {printf("%s.%s.cassandra.Latency.Write %s %s\n",tree,host, $0, now)}'"
#Heap and non-heap memory - Us de Memoria Heap i NoHeap
data="$data curl http://$host:8081/mbean?objectname=java.lang%3Atype%3DMemory -s|grep HeapMemoryUsage|awk -F"max=" '{print $2}'|cut -d"}" -f1|sed -e 's/, used=/n/g'|awk -v tree=$tree -v now=$now -v host=$host '(NR == 1) {printf("%s.%s.cassandra.internals.MaxJavaHeap %s %s\n",tree, host, $0, now)} (NR == 2) {printf("%s.%s.cassandra.internals.JavaHeapUsed %s %s\n",tree, host, $0, now)} (NR ==3) {printf("%s.%s.cassandra.internals.MaxJavaNoHeap %s %s\n",tree, host, $0, now)} (NR == 4) {printf("%s.%s.cassandra.internals.JavaNoHeapUsed %s %s\n",tree, host, $0, now)}'"
#Number of GarbageCollections - Numero de GarbageCollections
data="$data curl http://$host:8081/mbean?objectname=java.lang%3Atype%3DGarbageCollector%2Cname%3DConcurrentMarkSweep -s| grep CollectionCount|cut -d">" -f8|cut -d"<" -f1|awk -v tree=$tree -v now=$now -v host=$host '{printf("%s.%s.cassandra.internals.GarbageCollections %s %s\n",tree, host, $0, now)}'"
#echo $data
echo -e $data|nc -w 5 $carbon_server 2003
exit $?
The usage is simple, you just need to run it for each node in your cluster. And yes, it's pretty ugly. It would be prettier in python or perl. But as always, it started as a small thing with a simple query, and after that it growed slowly, until I find this monster... It's a shame, but I'll try to make an improved version in the future. Promise! 
Once we have all this values in graphite we must give them sense. Some of the values are useful as-is, for instance the number of connections or the pending operations. But the cumulative values, that is, the number of GarbageCollections or all CompletedTasks (Compaction completed tasks, as well as ReadStage, WriteStage and GossipStage) need the derivative function to be applied, so that we can know how many of them are there for each interval of time and detect this way if there are any unusual increases.
Finally, if we build a dashboard with these values, we should be able to find out fast if those problems we are having in our application are cassandra-related or cassandra is innocent. A dashboard could be like this one:
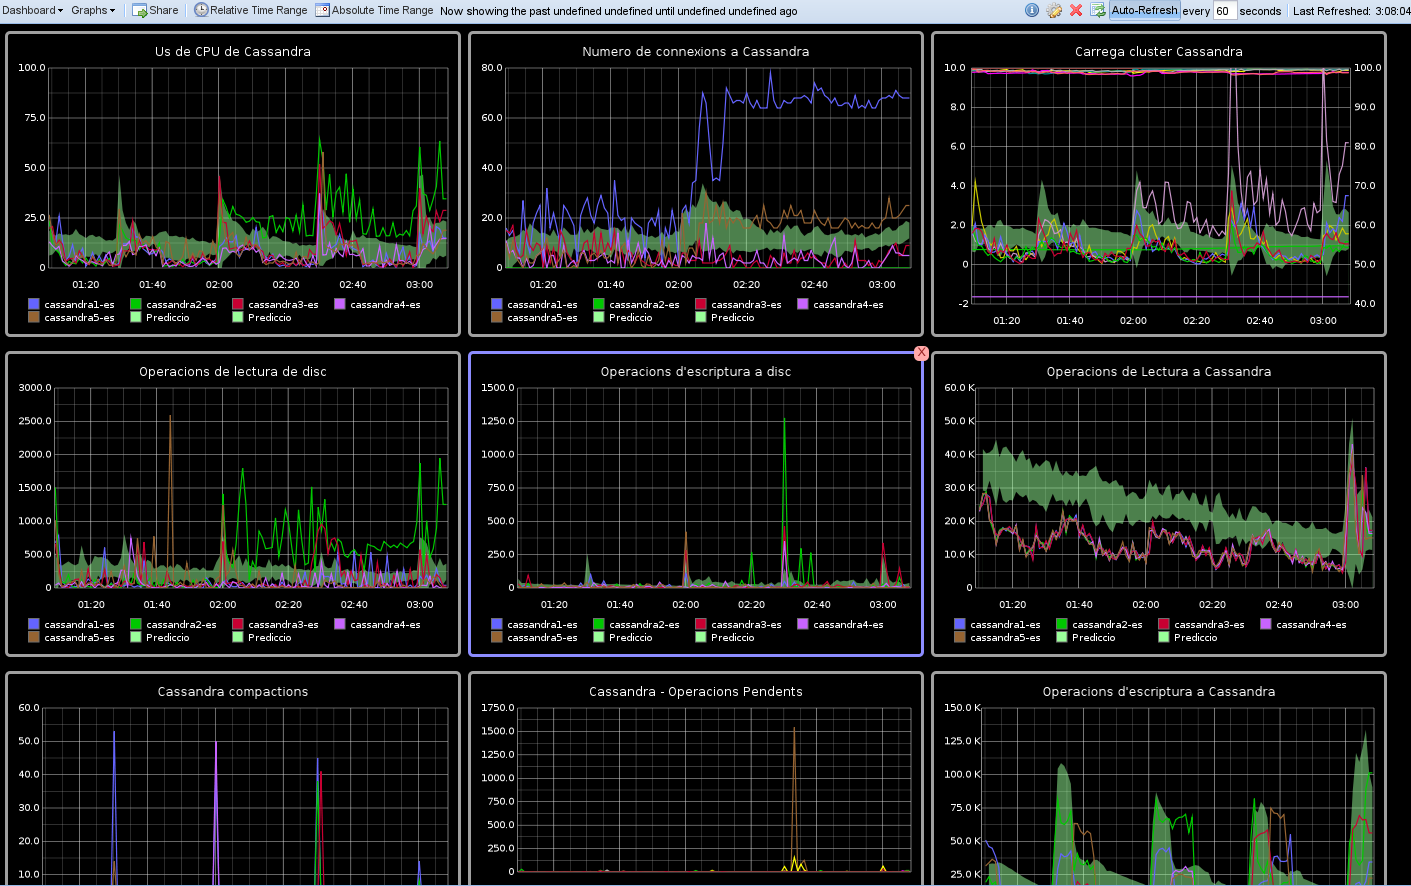
And nothing else for now. In a second stage I'll include ColumnFamily information. Any ideas?
Bibliography:
In previous posts we talked about installing graphite. Now we should send it some data to store, and then start to play with the webapp. Graphite can graph lots of things, but we will start with the basics: the state of a linux server.
We will decide if a server is healthy or not looking at the typical things in a linux: memory, disk space, CPU, iowait and disk read/write operations. There are a lot of ways to gather that information. I’ve chosen a shell-script executing standard commands (free, sar and awk, basically) and then sending then to carbon via netcat. You can find the script at github in graphite-monitoring repository, but I will paste it here as well because is simple and short:
|
1 2 3 4 5 6 7 8 9 10 11 12 13 14 15 16 17 18 19 20 21 22 23 24 25 26 27 28 29 |
#!/bin/bash #Carbon server where data should be stored for graphite to show - El servidor carbon on s'han de guardar les dades que mostra el graphite carbon_server=graphite.domain.tld # Tree structure where we want information to be stored - L'estructura de l'arbre on volem que es guardin les dades a graphite. tree="servers" #In this case, info will be shown in graphite as "servers.servername.loadavg_1min". We could use "pro" and "pre" to separate environments: "servers.pro.servername.loadavg_1min" - En el nostre cas es veuran a "servers.servername.loadavg_1min". Podriem posar "prod" i "pre" per separar entorns: "servers.pro.servername.loadavg_1min" now=`date +%s` host=`hostname` #Load average - Carrega read un cinc quinze resta < /proc/loadavg data="$tree.$host.loadavg_1min $un $now n $tree.$host.loadavg_5min $cinc $now n $tree.$host.loadavg_15min $quinze $now n" #Memory - Memoria data="$data `free -o|awk -v host=$host -v now=$now '(NR==2) {printf("servers.%s.memory %s %s \n ", host, $3/$2*100, now)} (NR==3) {printf("servers.%s.swap %s %s\n ", host, $3/$2*100, now)}'`" #CPU Used - Recollim CPU data="$data `sar -u 3|awk -v host=$host -v now=$now 'END {printf("servers.%s.cpu %s %s \n ", host, 100-$8, now)}'`" #Disk data - Recollim dades de disc data="$data `sar -b 3|awk -v host=$host -v now=$now 'END {printf("servers.%s.disk.totalops %s %s \n servers.%s.disk.readops %s %s \n servers.%s.disk.writeops %s %s \n servers.%s.disk.breads %s %s \n servers.%s.disk.bwrites %s %s \n ", host, $2, now, host, $3, now, host, $4, now, host, $5, now, host, $6, now)}'`" #Show data for debugging purpose - Mostrem les dades per depurar errors echo $data #Send data to graphite - Enviem dades a graphite echo -e $data |nc -w 5 $carbon_server 2003 2>&2 exit $? |
Now we just need to execute this regularly, using cron for instance. I run it with monit (someday I will talk about it), because it handles execution errors. And with that we will have some useful data in graphite to start to play.