After the latest posts, we know how to install cassandra and tune it a little . But that’s not enough, because before putting it on a production environment we must be able to guarantee cassandra is working OK, and having alerts when it’s not. That’s why we should integrate it inside our monitoring system, being Nagios, Zabbix, Zenoss, Graphite… Now we will identify where should we watch inside our cassandra cluster to detect issues or problems right in our monitoring systems.
First of all we want to make sure the server has enough available resources, and then check if the service is started and listening. In a recent post we talked about a script monitoring the linux basics . To check if the process is running we can do a typical /etc/init.d/cassandra status if we installed the init.d script, or “ps uax|grep CassandraDaemon|grep -v grep” if we didn’t. To check if cassandra ports are listening, we can do a netstat locally for each one of them: 7000 for gossip (netstat -l –numeric-ports|grep “:7000 “) and 9160 for thrift (netstat -l –numeric-ports|grep “:9160 “) or the same with netcat (locally or remotely) nc -z -w 3
But cassandra is very big, and it has lots of configurable parameters, and it’s not easy to know why it fails when it fails. And also it would be great if we could foresee when something bad is about to happen, before it actually happens. For all that we want more data, useful data to help us in our diagnostics, to see what’s happening internally and to find which parameters could be tuned to improve the performance. We will find this data in cassandra’s JMX console..
There are different ways to connect to this console. Typically we can use jconsole, anddatastax offers opscenter, but as we said, normally we want this data consolidated in our own monitoring system. There are some bridges between jmx and other systems (munin, for instance, through https://github.com/tcurdt/jmx2munin, or snmp through https://github.com/tcurdt/jmx2snmp or appdynamics). I was interested in graphite, so I needed to access this data from the console. With nodetool I could do some things (tpstats, cfstats, netstats, info, etc) but not all I wanted, and also the java calls were too heavy for my taste. Then I discovered mx4j, a bridge between jmx and HTTP, putting the data where our curl can reach it. Perfect! Exactly what I needed!
The installation is simple (http://wiki.apache.org/cassandra/Operations#Monitoring_with_MX4J), just download the jar, put it inside cassandra’s “lib” folder and restart. Usually as easy as:
wget "http://downloads.sourceforge.net/project/mx4j/MX4J%20Binary/3.0.2/mx4j-3.0.2.tar.gz"

tar zxf mx4j-3.0.2.tar.gz

mv mx4j-3.0.2/lib/mx4j-tools.jar /opt/cassandra/lib/

/etc/init.d/cassandra restart
Once cassandra has restarted, we can acess mx4j in port 8081 from our browser
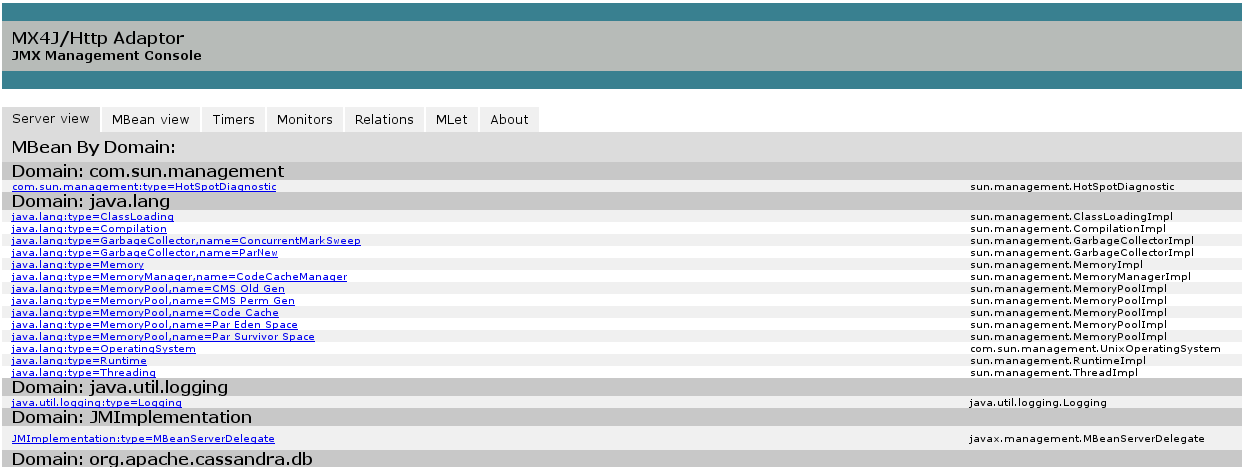
We will find there are TONS of data, and we don’t know the meaning of most of them (sorry, I’m not a java developer, there are quite a few things I don’t get :P). We have the description of most of the metrics inside cassandra documentation and from here we must choose which metrics are interesting. Reading some blogs (check the bibliography at the end of this post) I concluded the interesting data is:
- ReadStage, MutationStage, GossipStage tasks
- Compaction tasks
- Latency
- Heap and NoHeap memory usage
- Número de GarbageCollections
- Number of connections
- Data for each ColumnFamily
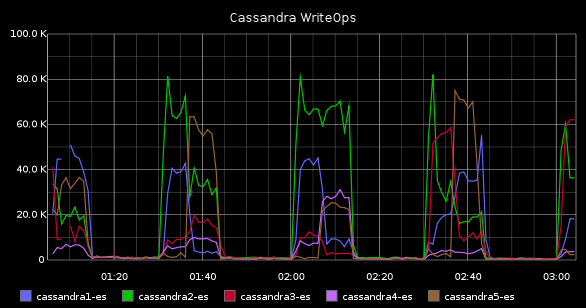
With this metrics we can measure the activity in each server counting the number of operations. The three types are read, write and “gossip” (inter-node communication). We will gather the total CompletedTasks where we will see how many operations per minute are being executed, the ActiveTasks where we will see how many concurrent tasks are in each node, and the PendingTasks where we will see the “pending” queue length. With this data we can see a lot of things: for instance, if the number of PendingTasks grows consistently our node may be receiving more queries than it can handle, or maybe we ran out of disk space and, failing to write in the commitlog, they are piling up (anyway, if this metric grows, something wrong is happening). If we see the load in our server grows, but also CompletedTasks increases at the same time, this may be “normal”.
We can find these values at:
http://$host:8081/mbean?objectname=org.apache.cassandra.request%3Atype%3DReadStage
http://$host:8081/mbean?objectname=org.apache.cassandra.request%3Atype%3DMutationStage
http://$host:8081/mbean?objectname=org.apache.cassandra.internal%3Atype%3DGossipStage
Normally they are related to activity in cluster. If there are lots of writes, usually there will be compactions. We will gather how many compactions are pending (PendingTasks) and completed (CompletedTasks), so we know how many there are, and if they’re piling up. For instance, if we find a loaded server with a long compaction queue, we should think about putting down compaction priority (nodetool setcompactionthroughput 1), or if we see our queue grows consistently, we should think about disabling thrift (nodetool disablethrift) to stop receiving new queries, and giving max priority to compactions, to get rid of them the sooner the better (nodetool setcompactionthroughput 999). These metrics will also help us to know when a repair, or scrub/rebuild, or upgradesstables, etc. ended (although there is now a progress indicator for repairs, since v1.1.9 and 1.2.2). Anyway, if these values are usually not zero, we will have worries. The link:
http://$host:8081/mbean?objectname=org.apache.cassandra.db%3Atype%3DCompactionManager
Here we will get the latency in operations. We want this value to be the lowest possible, and if it grows without reason we should find out why. We have 3 latency types, one for each operation: Range (RecentRangeLatencyMicros), Read (RecentReadLatencyMicros) and Write (RecentWriteLatencyMicros).
http://$host:8081/mbean?objectname=org.apache.cassandra.db%3Atype%3DStorageProxy
Here we will find how much memory is available for Java, and how much of it is busy. We will get HeapMemoryUsage and NoHeapMemoryUsage.
http://$host:8081/mbean?objectname=java.lang%3Atype%3DMemory -s
Here we will gather GarbageCollections in the system. This is related to the former metric (JavaHeap), because each GarbageCollection will free some memory. This will help us when the java process is GarbageCollecting too often and ends up wasting more time doing so than in its main task (read and write data!). We should check the GC frequency (ConcurrentMarkSweep). If it’s too often, we may need to add some more memory to the java process. Anyway, we want this value to be the lowest possible.
http://$host:8081/mbean?objectname=java.lang%3Atype%3DGarbageCollector%2Cname%3DConcurrentMarkSweep
Outside JMX there are also interesting things
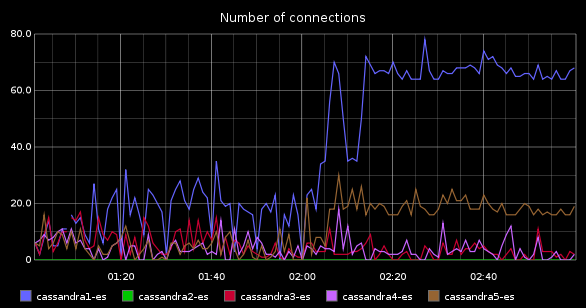
We want to know how many concurrent connections is Cassandra serving. This way, if cassandra load increases, we can correlate it to a users increase. If the number of users in our application doesn’t grow but cassandra connections do, something is wrong (the queries are slower, for instance). If the number of cassandra connections increases, and so do the number of users in our application, then this is “normal” and we should improve Cassandra (assigning more resources, or tuning the configuration) to fix it. This is a very interesting metric. It could be better, though. It would be great if we could see what transactions are active in cassandra (as does mysql show processlist) so we could see if there any badly constructed query or any that can be improved. But given cassandra’s architecture, this doesn’t seem feasible, so we will settle with the number of connections. I asked in cassandra-users mailing list if there is any way to get this number and they answered there is not such thing, but the find it interesting because it was frequently asked, so a developer ticket was created. Some day it will be implemented, I hope, and we will get his value from JMX. Meanwhile the only way is netstat:
connections=netstat -tn|grep ESTABLISHED|awk '{print $4}'|grep 9160|wc -l
To further squeeze Cassandra it’s also interesting to analyze each ColumnFamily Data. This way we can see size, activity, cache sucess rate, secondary indexes, etc. But these are lots of queries to mx4j (about 21 for each ColumnFamily, about 2000 HTTP queries in my case!), and this information doesn’t change so often, so I won’t gather it at the moment, and when I do it, I’ll get in 5-minutes interval, or 15 minutes, avoiding the server overload, so I’ll put that in a separate script.
And those are the interesting things we should monitor in cassandra. To gather this information I did a shell script. You can find it at my github profile, listed as cassandra-monitoring. It will get this information from mx4j in the servers (all but the established connections, this will come with netstat) and put it in a text string(“data“) to be sent later to graphite.
Here you have it:
#!/bin/bash
# WARNING - ATENCIO
# This script requires mx4j to be installed on cassandra monitored nodes. For more instructions visit:
# Aquest script necessita que el mx4j estigui instal·lat als nodes monitoritzats. Per mes instruccions visita:
# http://wiki.apache.org/cassandra/Operations#Monitoring_with_MX4J
#Carbon server where data should be stored for graphite to show - El servidor carbon on s'han de guardar les dades que mostra el graphite
carbon_server=graphite.domain.tld
# Tree structure where we want information to be stored - L'estructura de l'arbre on volem que es guardin les dades a graphite.
tree=servers
now=date +%s
host=${1:-localhost}
#Number of connections - Numero de connexions
if [ $host == "localhost" ];then
connections=netstat -tn|grep ESTABLISHED|awk '{print $4}'|grep 9160|wc -l
else
connections=ssh $host netstat -tn|grep ESTABLISHED|awk '{print $4}'|grep 9160|wc -l
fi
data="$tree.$host.cassandra.connections $connections $nown"
#Tasks in ReadStage - Tasques en ReadStage
data="$data curl http://$host:8081/mbean?objectname=org.apache.cassandra.request%3Atype%3DReadStage -s |egrep "CompletedTasks|PendingTasks|ActiveCount"|cut -d">" -f8|cut -d"<" -f1|awk -v tree=$tree -v now=$now -v host=$host '(NR == 1) {printf("%s.%s.cassandra.ReadStage.ActiveCount %s %s\n",tree, host, $0, now)} (NR == 2) {printf("%s.%s.cassandra.ReadStage.CompletedTasks %s %s\n",tree, host, $0, now)} (NR ==3) {printf("%s.%s.cassandra.ReadStage.PendingTasks %s %s\n",tree, host, $0, now)}'"
#Tasks in MutationStage - Tasques en MutationStage (writes)
data="$data curl http://$host:8081/mbean?objectname=org.apache.cassandra.request%3Atype%3DMutationStage -s |egrep "CompletedTasks|PendingTasks|ActiveCount"|cut -d">" -f8|cut -d"<" -f1|awk -v tree=$tree -v now=$now -v host=$host '(NR == 1) {printf("%s.%s.cassandra.MutationStage.ActiveCount %s %s\n",tree,host, $0, now)} (NR == 2) {printf("%s.%s.cassandra.MutationStage.CompletedTasks %s %s\n",tree,host, $0, now)} (NR ==3) {printf("%s.%s.cassandra.MutationStage.PendingTasks %s %s\n",tree, host, $0, now)}'"
#Tasks in GossipStage - Tasques en GossipStage (comunicacio interna entre cassandras)
data="$data curl http://$host:8081/mbean?objectname=org.apache.cassandra.internal%3Atype%3DGossipStage -s |egrep "CompletedTasks|PendingTasks|ActiveCount"|cut -d">" -f8|cut -d"<" -f1|awk -v tree=$tree -v now=$now -v host=$host '(NR == 1) {printf("%s.%s.cassandra.GossipStage.ActiveCount %s %s\n",tree, host, $0, now)} (NR == 2) {printf("%s.%s.cassandra.GossipStage.CompletedTasks %s %s\n",tree, host, $0, now)} (NR ==3) {printf("%s.%s.cassandra.GossipStage.PendingTasks %s %s\n",tree, host, $0, now)}'"
#Compaction tasks - Tasques de compactacio
data="$data curl http://$host:8081/mbean?objectname=org.apache.cassandra.db%3Atype%3DCompactionManager -s|egrep "CompletedTasks|PendingTasks"|cut -d">" -f8|cut -d"<" -f1|awk -v tree=$tree -v now=$now -v host=$host '(NR == 1) {printf("%s.%s.cassandra.Compaction.CompletedTasks %s %s\n",tree, host, $0, now)} (NR == 2) {printf("%s.%s.cassandra.Compaction.PendingTasks %s %s\n",tree, host, $0, now)}'"
#Operation Latency - Latencia d'operacions
data="$data curl http://$host:8081/mbean?objectname=org.apache.cassandra.db%3Atype%3DStorageProxy -s |egrep "RecentRangeLatencyMicros|RecentReadLatencyMicros|RecentWriteLatencyMicros"|cut -d">" -f8|cut -d"<" -f1|awk -v tree=$tree -v now=$now -v host=$host '(NR == 1) {printf("%s.%s.cassandra.Latency.Range %s %s\n",tree, host, $0, now)} (NR == 2) {printf("%s.%s.cassandra.Latency.Read %s %s\n",tree,host, $0, now)} (NR ==3) {printf("%s.%s.cassandra.Latency.Write %s %s\n",tree,host, $0, now)}'"
#Heap and non-heap memory - Us de Memoria Heap i NoHeap
data="$data curl http://$host:8081/mbean?objectname=java.lang%3Atype%3DMemory -s|grep HeapMemoryUsage|awk -F"max=" '{print $2}'|cut -d"}" -f1|sed -e 's/, used=/n/g'|awk -v tree=$tree -v now=$now -v host=$host '(NR == 1) {printf("%s.%s.cassandra.internals.MaxJavaHeap %s %s\n",tree, host, $0, now)} (NR == 2) {printf("%s.%s.cassandra.internals.JavaHeapUsed %s %s\n",tree, host, $0, now)} (NR ==3) {printf("%s.%s.cassandra.internals.MaxJavaNoHeap %s %s\n",tree, host, $0, now)} (NR == 4) {printf("%s.%s.cassandra.internals.JavaNoHeapUsed %s %s\n",tree, host, $0, now)}'"
#Number of GarbageCollections - Numero de GarbageCollections
data="$data curl http://$host:8081/mbean?objectname=java.lang%3Atype%3DGarbageCollector%2Cname%3DConcurrentMarkSweep -s| grep CollectionCount|cut -d">" -f8|cut -d"<" -f1|awk -v tree=$tree -v now=$now -v host=$host '{printf("%s.%s.cassandra.internals.GarbageCollections %s %s\n",tree, host, $0, now)}'"
#echo $data
echo -e $data|nc -w 5 $carbon_server 2003
exit $?
The usage is simple, you just need to run it for each node in your cluster. And yes, it's pretty ugly. It would be prettier in python or perl. But as always, it started as a small thing with a simple query, and after that it growed slowly, until I find this monster... It's a shame, but I'll try to make an improved version in the future. Promise! 
Once we have all this values in graphite we must give them sense. Some of the values are useful as-is, for instance the number of connections or the pending operations. But the cumulative values, that is, the number of GarbageCollections or all CompletedTasks (Compaction completed tasks, as well as ReadStage, WriteStage and GossipStage) need the derivative function to be applied, so that we can know how many of them are there for each interval of time and detect this way if there are any unusual increases.
Finally, if we build a dashboard with these values, we should be able to find out fast if those problems we are having in our application are cassandra-related or cassandra is innocent. A dashboard could be like this one:
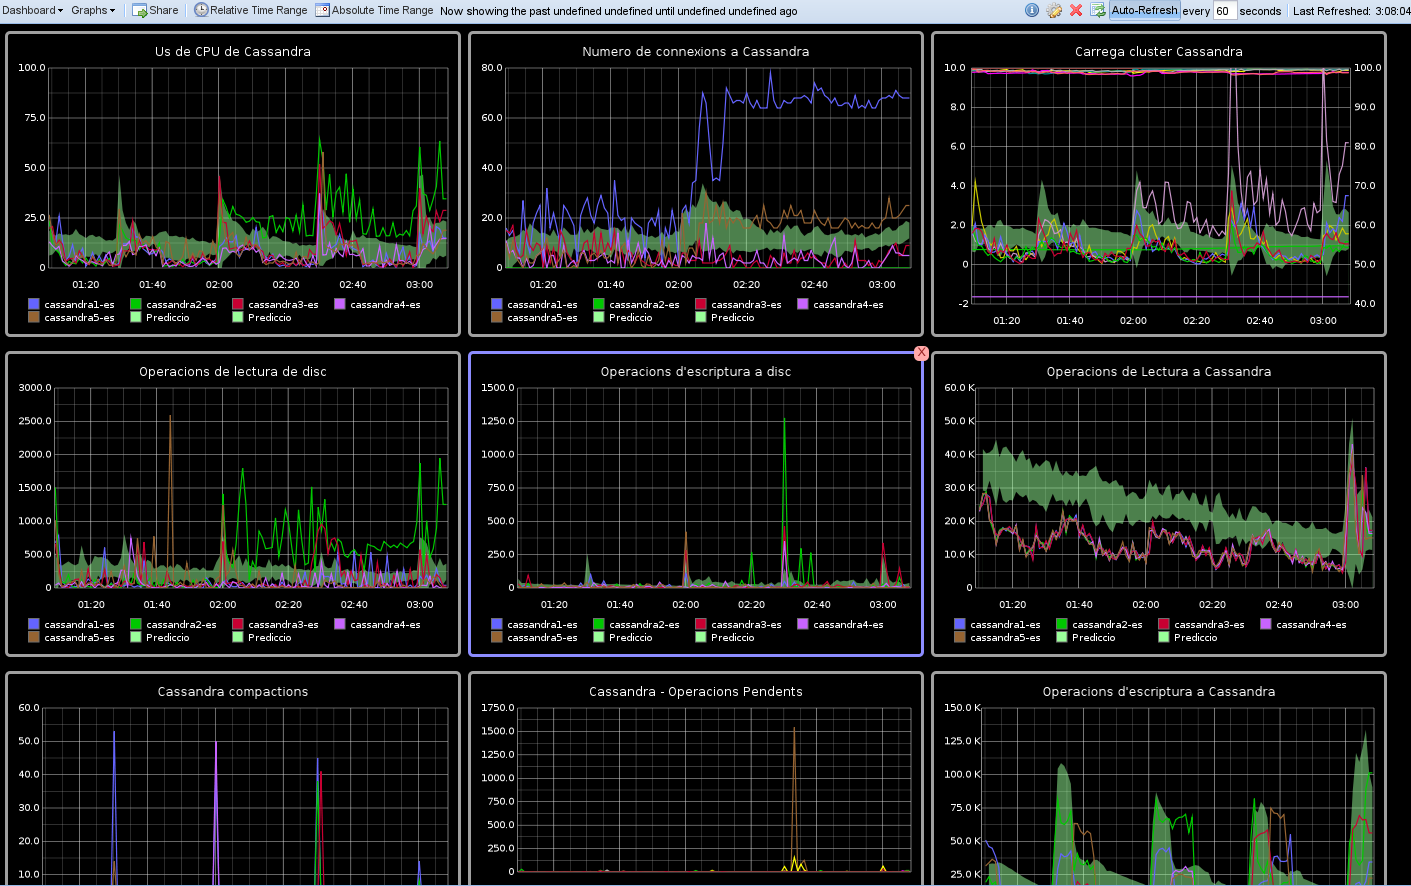
And nothing else for now. In a second stage I'll include ColumnFamily information. Any ideas?
Bibliography:
- http://www.manageengine.com/products/applications_manager/cassandra-monitoring.html
- http://jonathanhui.com/cassandra-performance-tuning-and-monitoring
- http://www.datastax.com/docs/1.1/operations/monitoring
- http://wiki.apache.org/cassandra/Operations#Monitoring
- http://suniluiit.wordpress.com/2011/02/21/apache-cassandra-monitoring-through-hyperic-hq/