Basic rundeck installation in RedHat, using apache as a proxy and mysql as a database

When we have lots of servers and we need to execute jobs regularly, we rapidly outgrow cron, because the information is spreaded along all the servers and you don’t have an easy way to, for instance, check the execution result of a task in all servers, or what tasks were running between 16:33 and 16:36, or to find the less busy spot to schedule a new job in your architecture. And many other things.

To centralize this information there are some alternatives. Recently, the nerds in airbnb have released chronos and it seems a good way to go, but I’ve been using rundeck for a while and I’m very happy with it.

It works in a simple way: it’s a java daemon with a grails interface for the web access, and a quartz scheduler for event scheduling. This server makes ssh connections to the remote servers to execute the configured tasks. This allows us to have a centralized cron (our original intent with this article), but we can also use it as a centralized sudo (we can decide which user can run which command in which servers, all from the web console, without giving away ssh access at all), and also allows us to have a centralized shell, so we can run a command in several servers at the same time, like terminator or more like fabric .

Now that we’ve introduced rundeck, let’s start installing in our RedHat. We must have in mind that rundeck runs with the rundeck user, so it’s unprivileged, so it can’t use port 80. To make it work for this example, we will proxypass with apache. First of all we install apache (obvious):


# yum install httpd

Then we edit /etc/httpd/conf/httpd.conf file and add two lines:


ProxyPass / http://localhost:4440/
ProxyPassReverse / http://localhost:4440/

This way apache will forward al the connexions in port 80 to port 4440, where rundeck is awaiting.
Now for the data. Rundeck uses a database file by default (formerly it used hsql, now it uses h2). This is fine, but at some point we will outgrow it. To avoid that, we will use a mysql database. First we install it (obvious, again):


yum install mysql mysqld
chkconfig mysqld on

We can tune it editing my.cnf with the usual (default-storage-engine=innodb, innodb_file_per_table, etc, etc). After that we need to create a database for rundeck, and a user with permissions:

[[email protected] rundeck]# mysql -p
Enter password: Welcome to the MySQL monitor. Commands end with ; or g.
Your MySQL connection id is 18536
Server version: 5.5.30 MySQL Community Server (GPL) by Remi

Copyright (c) 2000, 2013, Oracle and/or its affiliates. All rights reserved.

Oracle is a registered trademark of Oracle Corporation and/or its
affiliates. Other names may be trademarks of their respective
owners.

Type 'help;' or 'h' for help. Type 'c' to clear the current input statement.

mysql> create database rundeck;
Query OK, 1 row affected (0.00 sec)

mysql> grant all on rundeck.* to 'rundeck'@'localhost' identified by 'password';
Query OK, 0 rows affected (0.00 sec)

mysql> quit
Bye

Now we install rundeck, first the official application repo and then the program itself:


wget http://repo.rundeck.org/latest.rpm
rpm -Uvh latest.rpm
yum install rundeck

And we configure the database in the file /etc/rundeck/rundeck-config.properties, commenting out the existing line and adding three more:


#dataSource.url = jdbc:h2:file:/var/lib/rundeck/data/rundeckdb
dataSource.url = jdbc:mysql://localhost/rundeck
dataSource.username = rundeck
dataSource.password = password

Now we start it


/etc/init.d/rundeck start

We can check it’s using the database because it will create its tables:


[[email protected] rundeck]# mysql -p
Enter password:
Welcome to the MySQL monitor. Commands end with ; or g.
Your MySQL connection id is 31
Server version: 5.5.30 MySQL Community Server (GPL) by Remi

Copyright (c) 2000, 2013, Oracle and/or its affiliates. All rights reserved.

Oracle is a registered trademark of Oracle Corporation and/or its
affiliates. Other names may be trademarks of their respective
owners.

Type 'help;' or 'h' for help. Type 'c' to clear the current input statement.

mysql> use rundeck
Reading table information for completion of table and column names
You can turn off this feature to get a quicker startup with -A

Database changed
mysql> show tables;
+----------------------------+
| Tables_in_rundeck |
+----------------------------+
| auth_token |
| base_report |
| execution |
| node_filter |
| notification |
| rdoption |
| rdoption_values |
| rduser |
| report_filter |
| scheduled_execution |
| scheduled_execution_filter |
| workflow |
| workflow_step |
| workflow_workflow_step |
+----------------------------+
14 rows in set (0.00 sec)

We have our service running. Now we must export our public ssh key to gain access to run commands on the remote servers:


[[email protected] .ssh]# su - rundeck
[[email protected] ~]$ ssh-keygen
Generating public/private rsa key pair.
Enter file in which to save the key (/var/lib/rundeck/.ssh/id_rsa): project1_rsa
Enter passphrase (empty for no passphrase):
Enter same passphrase again:
Your identification has been saved in project1_rsa.
Your public key has been saved in project1_rsa.pub.
The key fingerprint is:
f6:be:e5:0r:b2:zd:9b:89:1e:2c:6f:fc:od:e5:a5:00 [email protected]
[[email protected] ~]$ ssh-copy-id -i /var/lib/rundeck/.ssh/project1_rsa [email protected]
[email protected]'s password:
0
The authenticity of host 'server2 (222.333.444.555)' can't be established.
RSA key fingerprint is b6:6z:34:2o:04:2f:j1:71:1e:12:b3:fd:e2:f2:79:cf.
Are you sure you want to continue connecting (yes/no)? yes
Warning: Permanently added 'server2-es,222.333.444.555' (RSA) to the list of known hosts.
Now try logging into the machine, with "ssh [email protected]'", and check in:

.ssh/authorized_keys

to make sure we haven't added extra keys that you weren't expecting.

[[email protected] ~]$ ssh [email protected] whoami
user

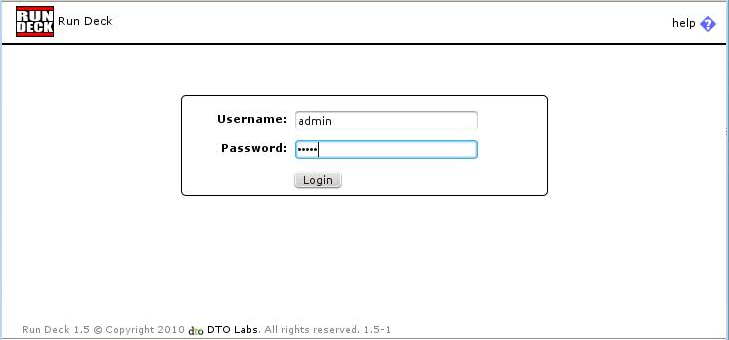
Stay with me, we’re almost there. Now we can log in the web with user admin and password admin:
rundeck login

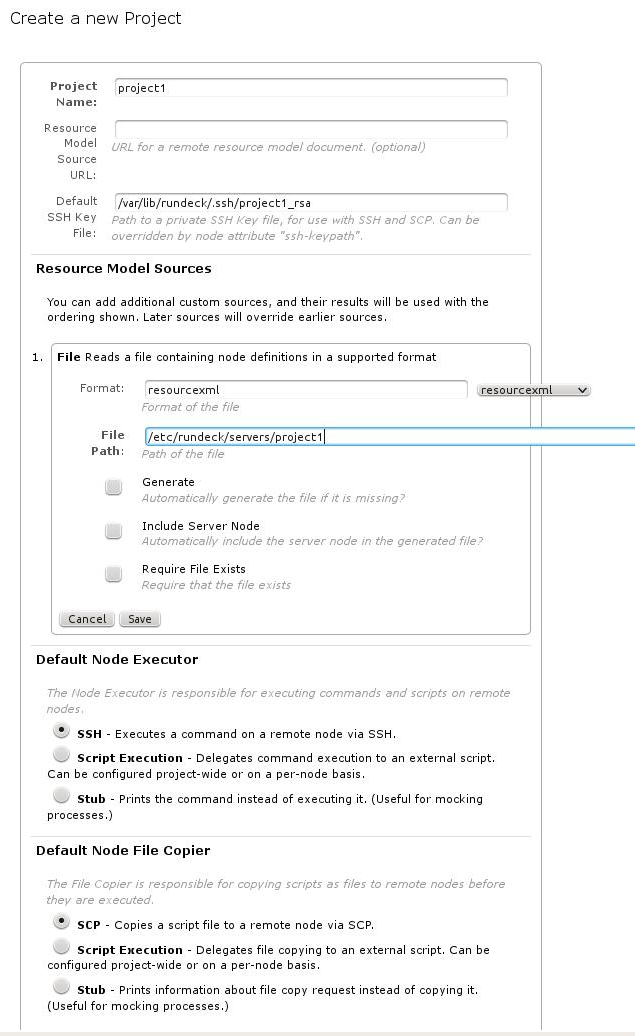
The first thing is to create a project, and here we put the former information

rundeck create project

When the project is generated, we will land on the project page, where we can run local commands:
rundeck home

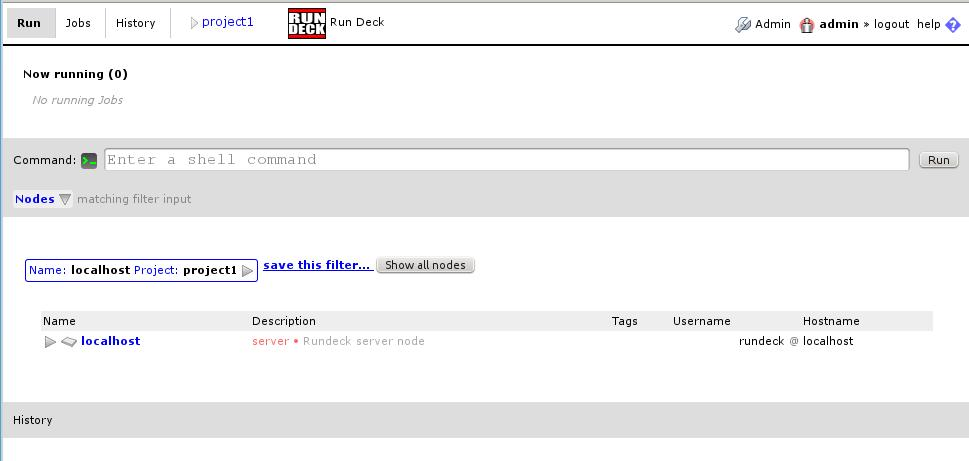
Now for the last step, adding the remote servers. As we configured in the project creation, we will put them in the file /etc/rundeck/servers/project1 in xml format:

Once we add them, we can use them without restarting, just clicking “show all nodes” button:

rundeck home with new server

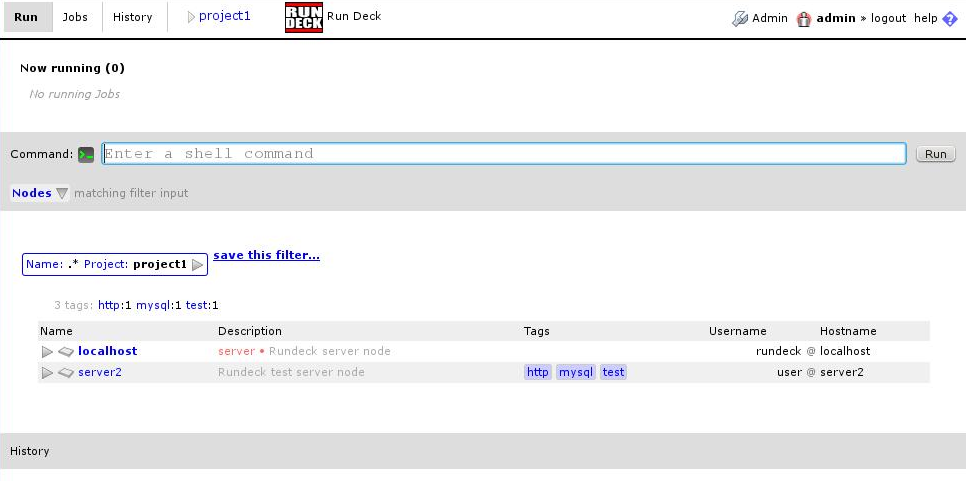
And that’s it. From this point on it’s very easy. In this console we can run remote commands, and in the “jobs” tab we can create jobs.

There are some more things we can configure. For instance, we can change the rundeck logo to put our company’s logo in the file /etc/rundeck/rundeck-config.properties

rundeck.gui.title = Programador de tareas de la nostra empresa
rundeck.gui.logo = logo.jpg
rundeck.gui.logo-width = 68
rundeck.gui.logo-heigh = 31

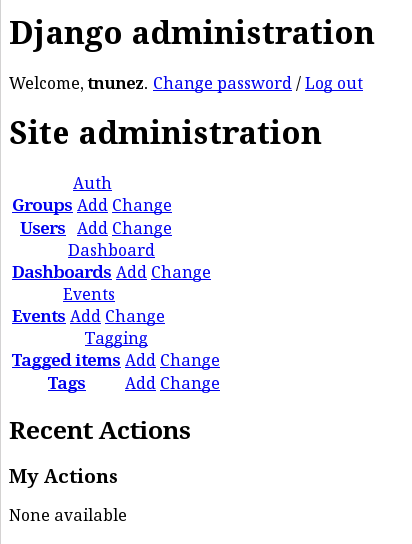
Or if we want to create more users, or to change admin password (you should change it!) we will add them to /etc/rundeck/realm.properties

admin: MD5:5a527f8fegf916h8485dj6681ff8d7a6a,user,admin,architect,deploy,build
newuser: MD5:0cddh73e3g6108a7fh5f3716a9jf97and4e56ff,user

And permissions are managed in the file /etc/rundeck/admin.aclpolicy.

With all this we are ready to start playing with rundeck.

Graphite user creation

Graphite is a powerful graphing tool. It allow you to graph anything fast and applying lots of functions so you can have the data exactly as you want. All graph configuration parameters (data to show, dimensions of the graph, legend, functions, etc) are in the URL itself, so if we want to share a particular graph, we just need to share the URL. But graphite has a way to store the graphs and keep them close at “My Graphs” or “User Graphs”, pretty handy. To store the graphs first we need to authenticate (graphs must be assigned to someone!) and, obviously, to authenticate we need to have a user. And in the previous post explaining how to install graphite, that wasn’t explained.

Users, graphs and dashboards are stored in the file /opt/graphite/storage/graphite.db, which is a sqlite database. We can look at the contents (sqlclent3 required!):

$ cd /opt/graphite/webapp/graphite
$ python manage.py dbshell
Error: You appear not to have the 'sqlite3' program installed or on your path.
$ sudo apt-get install sqlite3
(...)
Processing triggers for man-db ...
Setting up sqlite3 (3.7.3-1) ...
$ python manage.py dbshell
SQLite version 3.7.3
Enter ".help" for instructions
Enter SQL statements terminated with a ";"
sqlite> .databases
seq name file
--- --------------- ----------------------------------------------------------
0 main /opt/graphite/storage/graphite.db
sqlite> .table
account_mygraph auth_user_groups
account_profile auth_user_user_permissions
account_variable dashboard_dashboard
account_view dashboard_dashboard_owners
account_window django_admin_log
auth_group django_content_type
auth_group_permissions django_session
auth_message events_event
auth_permission tagging_tag
auth_user tagging_taggeditem
sqlite> ^D
$

We will not modify this data ourselves (that would require us to understand exactly what that means, and I’m not in the mood right now :P), because we will do that through graphite (technically, through its framework, django). First of all we need a superuser, which we create from the command line:


$ cd /opt/graphite/webapp/graphite
$ python manage.py createsuperuser
Username: tomas
E-mail address: [email protected]
Password: xxxxxx
Password (again): xxxxxx
Superuser created successfully.
$

Now we can login with this user and pass in the login at te top of the page.

Fer login al graphite

Once authenticated, we can go to the admin interface in “/admin/“, as in http://your-graphite-server.tld/admin/, and here we can add all the users we want.

Panel d'administracio django a graphite

Varnish basic configuration with http cache and stale-while

In high-demand environments, we can reach the point where the number of PHP queries (or CGI queries) we want to serve through apache httpd is higher than our servers can handle. To solve that we can do the simplest thing: adding more servers, lowering this way the servers load (the queries are spreaded along more servers). But the simplest way isn’t necesarily proficient. Instead of distributing the load, can our servers handle more queries?

Of course. We can speed up the PHP (or general CGI) processing with FastCGI. We can also make our http server faster, exchanging it for a lighter one, nginx for instance. We can approach the problem from other perspective, which we will discuss here: mantaining a cache where we store content, instead of processing it each time, avoiding CPU time and speeding up the time it takes to serve it. We will do that using varnish .

Maintaining a cache is a delicate matter because you should look for a lot of things. You shouldn’t cache a page if it has cookies involved, for instance, or if the http query is a POST. But all of this is app-related. Developers should be able to say what is safe to cache and what is not, and sysadmins should take this decisions to the servers. So we will assume we start from scratch, we have nothing in the varnish cache, and we want to begin with a particular URL, which we know implies no risk. We will do that here, caching just one URL.

For our tests we will use a simple PHP file. It takes 10 seconds to return the result, and it has a header expiring after 5 seconds. We will name it sleep.php:

If we query it, we can check it do take 10 seconds to return:

$ curl http://localhost/sleep.php -w %{time_total}
10,001

The first thing we should do is to install varnish with our package manager (apt-get install varnish, yum install varnish, whatever). After that we want varnish listening in port 80, instead of apache. So we move apache to 8080 for instance (“Listen: ” directive), and then varnish to 80 (VARNISH_LISTEN_PORT= directive, usually in /etc/default/varnish or /etc/sysconfig/varnish, depends on your distro). We also need to tell varnish the servers it will have behind, to forward the queries (backend servers). For that we will create /etc/varnish/default.vcl file with the following contents:


backend default {
.host = "127.0.0.1";
.port = "8080";
}

With all this we restart apache and varnish, and we check they are running:


$ curl http://localhost/sleep.php -IXGET
HTTP/1.1 200 OK
Server: Apache/2.2.22 (Ubuntu)
X-Powered-By: PHP/5.3.10-1ubuntu3.4
Cache-control: max-age=5, must-revalidate
Vary: Accept-Encoding
Content-Type: text/html
Transfer-Encoding: chunked
Date: Fri, 30 Nov 2012 13:56:33 GMT
X-Varnish: 1538615861
Age: 0
Via: 1.1 varnish
Connection: keep-alive

$ curl http://localhost:8080/sleep.php -IXGET
HTTP/1.1 200 OK
Date: Fri, 30 Nov 2012 13:56:59 GMT
Server: Apache/2.2.22 (Ubuntu)
X-Powered-By: PHP/5.3.10-1ubuntu3.4
Cache-control: max-age=5, must-revalidate
Vary: Accept-Encoding
Content-Length: 0
Content-Type: text/html

We can see different headers in each query. When we query varnish there are “Via: 1.1 varnish” and “Age: 0”, among others apache doesn’t show. If we have it like this, we have our baseline.

The default behaviour is to cache everything:

$ curl http://localhost/sleep.php -w %{time_total}
10,002
$ curl http://localhost/sleep.php -w %{time_total}
0,001

But we don’t want to cache everything, just a particular URL, avoiding cache of cookies and things like that. So we will change sub vcl_recv to not cache anything, adding this to the file /etc/varnish/default.vcl:

sub vcl_recv {
return(pass);
}

We check it:

$ curl http://localhost/sleep.php -w %{time_total}
10,002
$ curl http://localhost/sleep.php -w %{time_total}
10,001

Now we cache just sleep.php, adding this to default.vcl:

sub vcl_recv {
if (req.url == "/sleep.php")
{
return(lookup);
}
else
{
return(pass);
}
}

We can check it:

$ cp /var/www/sleep.php /var/www/sleep2.php
$ curl http://localhost/sleep.php -w %{time_total}
10,002
$ curl http://localhost/sleep.php -w %{time_total}
0,001
$ curl http://localhost/sleep2.php -w %{time_total}
10,002
$ curl http://localhost/sleep2.php -w %{time_total}
10,001

Also we check the “Age:” header is increasing, and when it reaches 5 (max-age we wrote), it takes 10 seconds again:

$ curl http://localhost/sleep.php -IXGET -w %{time_total}
HTTP/1.1 200 OK
Server: Apache/2.2.22 (Ubuntu)
X-Powered-By: PHP/5.3.10-1ubuntu3.4
Cache-control: max-age=5, must-revalidate
Vary: Accept-Encoding
Content-Type: text/html
Transfer-Encoding: chunked
Date: Mon, 03 Dec 2012 10:53:54 GMT
X-Varnish: 500945303
Age: 0
Via: 1.1 varnish
Connection: keep-alive

10,002
$ curl http://localhost/sleep.php -IXGET -w %{time_total}
HTTP/1.1 200 OK
Server: Apache/2.2.22 (Ubuntu)
X-Powered-By: PHP/5.3.10-1ubuntu3.4
Cache-control: max-age=5, must-revalidate
Vary: Accept-Encoding
Content-Type: text/html
Transfer-Encoding: chunked
Date: Mon, 03 Dec 2012 10:53:56 GMT
X-Varnish: 500945305 500945303
Age: 2
Via: 1.1 varnish
Connection: keep-alive

0,001
$ curl http://localhost/sleep.php -IXGET -w %{time_total}
HTTP/1.1 200 OK
Server: Apache/2.2.22 (Ubuntu)
X-Powered-By: PHP/5.3.10-1ubuntu3.4
Cache-control: max-age=5, must-revalidate
Vary: Accept-Encoding
Content-Type: text/html
Transfer-Encoding: chunked
Date: Mon, 03 Dec 2012 10:53:59 GMT
X-Varnish: 500945309 500945303
Age: 5
Via: 1.1 varnish
Connection: keep-alive

0,001
$ curl http://localhost/sleep.php -IXGET -w %{time_total}
HTTP/1.1 200 OK
Server: Apache/2.2.22 (Ubuntu)
X-Powered-By: PHP/5.3.10-1ubuntu3.4
Cache-control: max-age=5, must-revalidate
Vary: Accept-Encoding
Content-Type: text/html
Transfer-Encoding: chunked
Date: Mon, 03 Dec 2012 10:54:09 GMT
X-Varnish: 500945310
Age: 0
Via: 1.1 varnish
Connection: keep-alive

10,002

We can see when the content expires, varnish ask for it agains and it takes 10 seconds. But what happens during this time? The rest of queries must wait, too? No, they don’t. There is a 10 seconds grace period, and during this period varnish will keep serving the old content (stale content). We can check it if we run two curl at the same time, and we will see one of them stops while the other keeps serving content fast, with the header “Age” above the 5 seconds we assigned:

$ while :;do curl http://localhost/sleep.php -IXGET;sleep 1;done
(...)
HTTP/1.1 200 OK
Server: Apache/2.2.22 (Ubuntu)
X-Powered-By: PHP/5.3.10-1ubuntu3.4
Cache-control: max-age=5, must-revalidate
Vary: Accept-Encoding
Content-Type: text/html
Transfer-Encoding: chunked
Date: Mon, 03 Dec 2012 11:16:29 GMT
X-Varnish: 500952300 500952287
Age: 8
Via: 1.1 varnish
Connection: keep-alive

We can also check it with siege, with two concurrent users, and we will see for a while just one of the threads, while the other is stopped, waiting for the content.:

$ siege -t 30s -c 2 -d 1 localhost/sleep.php

If we think 10 seconds is a low value, we can change it with the beresp.grace directive, in the sub vcl_fetch in default.vcl file. We can set a minute, for instance:

sub vcl_fetch {
set beresp.grace = 60s;
}

What if the backend server is down? Will it keep serving stale content? Not as we have it right now. Because varnish has no way of knowing if a backend server is healthy or not, so it will consider all servers healthy. So, if the server is down, and the content expires, it will give error 503:

$ $ sudo /etc/init.d/apache2 stop
[sudo] password:
* Stopping web server apache2 apache2: Could not reliably determine the server's fully qualified domain name, using 127.0.1.1 for ServerName
... waiting [OK]
$ sudo /etc/init.d/apache2 status
Apache2 is NOT running.
$ while :;do curl http://localhost/sleep.php -IXGET;sleep 1;done
(...)
HTTP/1.1 200 OK
Server: Apache/2.2.22 (Ubuntu)
X-Powered-By: PHP/5.3.10-1ubuntu3.4
Cache-control: max-age=5, must-revalidate
Vary: Accept-Encoding
Content-Type: text/html
Transfer-Encoding: chunked
Date: Fri, 30 Nov 2012 14:19:15 GMT
X-Varnish: 1538616905 1538616860
Age: 5
Via: 1.1 varnish
Connection: keep-alive

HTTP/1.1 503 Service Unavailable
Server: Varnish
Content-Type: text/html; charset=utf-8
Retry-After: 5
Content-Length: 419
Accept-Ranges: bytes
Date: Fri, 30 Nov 2012 14:19:15 GMT
X-Varnish: 1538616906
Age: 0
Via: 1.1 varnish
Connection: close

To make the grace period apply in this situation, we just need to tell varnish how should it check if apache is up or down (healthy), just setting “probe” directive in the backend:

backend default {
.host = "127.0.0.1";
.port = "8080";
.probe = {
.url = "/";
.timeout = 100 ms;
.interval = 1s;
.window = 10;
.threshold = 8;
}
}

This way it keeps serving stale content when the backend is down, and it will keep serving it until it comes up and varnish can ask for the content again.

Testing with siege and curl, we can see there is always a thread that is “screwed”. The first time varnish finds an expired content, it asks for it to the backend and waits for the answer. Meanwhile, the rest of the threads will get the stale content, but this thread is “screwed”. The same thing happens when the server is down. There is a lot of literature trying to avoid this, you can read a lot about it, but bottomline: there is no way to avoid it. It just happens. One thread must be sacrificed.

Until now we are covering two scenarios where we will keep serving stale content:
– There is no backend server available, so we serve stale content.
– There is backends available, and a thread has asked for new content. While this content comes from the backend, varnish keeps serving stale content to the rest of the threads.

What if we want these two scenarios to have different timeouts? For instance, we could need the stale content to stop serving after certaing time (could be minutes). After this time, we stop and wait for the backend answer, forcing the content to be fresh. But at the same sime we could need to serve stale content when the servers are down (so there’s no way to get fresh content), because normally that’s better than serve a 503 error page. This can be configured at sub vcl_recv in default.vcl file, this way:

sub vcl_recv {
if (req.backend.healthy) {
set req.grace = 30s;
} else {
set req.grace = 1h;
}
}

sub vcl_fetch {
set beresp.grace = 1h;
}

Per tant, el nostre fitxer default.vcl complet tindra el seguent contingut:

$ cat /etc/varnish/default.vcl
backend default {
.host = "127.0.0.1";
.port = "8080";
.probe = {
.url = "/";
.timeout = 100 ms;
.interval = 1s;
.window = 10;
.threshold = 8;
}
}

sub vcl_recv {
if (req.backend.healthy) {
set req.grace = 30s;
} else {
set req.grace = 1h;
}
if (req.url == "/sleep.php")
{
return(lookup);
}
else
{
return(pass);
}
}
sub vcl_fetch {
set beresp.grace = 30s;
}

Troubleshooting pacemaker: Pacemaker IP doesn’t appear in ifconfig

People who are used to manage our network devices through ifconfig, we find some trouble when putting a virtual IP in pacemaker, because we can’t see it. If we type ip addr there it is, but not with ifconfig. To make it visible we just need to use iflabel=”label” option, and we will see the IP, and with “ip addr” we will now fast which is the server IP and which is the service IP in pacemaker:

#crm configure show
(...)
primitive IP_VIRTUAL ocf:heartbeat:IPaddr2
params ip="10.0.0.11" cidr_netmask="32" iflabel="IP_VIRTUAL"
op monitor interval="3s"
meta target-role="Started"
(...)

IMPORTANT: Device label accept only 10 characters. If we put more than 10, pacemaker won’t be able to start the virtual IP and will fail (this gave me some headaches :D). Make sure you put 10 characters at most.

Without iflabel it doesn’t appear in ifconfig and isn’t labeled in ip addr:

# ip addr
1: lo: mtu 16436 qdisc noqueue state UNKNOWN
link/loopback 00:00:00:00:00:00 brd 00:00:00:00:00:00
inet 127.0.0.1/8 scope host lo
inet6 ::1/128 scope host
valid_lft forever preferred_lft forever
2: eth0: mtu 1500 qdisc pfifo_fast state UP qlen 1000
link/ether 00:50:56:9e:3c:94 brd ff:ff:ff:ff:ff:ff
inet 10.0.0.1/24 brd 10.0.0.255 scope global eth0
inet 10.0.0.11/32 brd 10.0.0.11 scope global eth0
inet 10.0.0.12/32 brd 10.04.0.12 scope global eth0
inet 10.0.0.13/32 brd 10.0.0.13 scope global eth0
inet 10.0.0.14/32 brd 10.0.0.14 scope global eth0
inet6 fe80::250:56ff:fe9e:3c94/64 scope link
valid_lft forever preferred_lft forever
# ifconfig
eth0 Link encap:Ethernet HWaddr 00:50:56:9E:3C:94
inet addr:10.0.0.1 Bcast:10.10.0.255 Mask:255.255.255.0
inet6 addr: fe80::250:56ff:fe9e:3c94/64 Scope:Link
UP BROADCAST RUNNING MULTICAST MTU:1500 Metric:1
RX packets:1825681745 errors:0 dropped:0 overruns:0 frame:0
TX packets:2044189443 errors:0 dropped:0 overruns:0 carrier:0
collisions:0 txqueuelen:1000
RX bytes:576307237739 (536.7 GiB) TX bytes:605505888813 (563.9 GiB)

lo Link encap:Local Loopback
inet addr:127.0.0.1 Mask:255.0.0.0
inet6 addr: ::1/128 Scope:Host
UP LOOPBACK RUNNING MTU:16436 Metric:1
RX packets:924190306 errors:0 dropped:0 overruns:0 frame:0
TX packets:924190306 errors:0 dropped:0 overruns:0 carrier:0
collisions:0 txqueuelen:0
RX bytes:415970933288 (387.4 GiB) TX bytes:415970933288 (387.4 GiB)


However, if we use iflabel, there they are:

[[email protected] ~]# ip addr
1: lo: mtu 16436 qdisc noqueue state UNKNOWN
link/loopback 00:00:00:00:00:00 brd 00:00:00:00:00:00
inet 127.0.0.1/8 scope host lo
inet6 ::1/128 scope host
valid_lft forever preferred_lft forever
2: eth1: mtu 1500 qdisc pfifo_fast state UP qlen 1000
link/ether 00:50:56:9e:3c:9c brd ff:ff:ff:ff:ff:ff
inet 10.0.0.1./24 brd 10.254.1.255 scope global eth1
inet 10.0.0.11/32 brd 10.0.0.11 scope global eth1:nginx-ncnp
inet 10.0.0.12/32 brd 10.0.0.12 scope global eth1:nginx-clnp
inet 10.0.0.13/32 brd 10.0.0.13 scope global eth1:hap-ncnp
inet 10.0.0.14/32 brd 10.254.1.14 scope global eth1:hap-clnp
inet6 fe80::250:56ff:fe9e:3c9c/64 scope link
valid_lft forever preferred_lft forever
[[email protected] ~]# ifconfig
eth1 Link encap:Ethernet HWaddr 00:50:56:9E:3C:9C
inet addr:10.0.0.1 Bcast:10.0.0.255 Mask:255.255.255.0
inet6 addr: fe80::250:56ff:fe9e:3c9c/64 Scope:Link
UP BROADCAST RUNNING MULTICAST MTU:1500 Metric:1
RX packets:322545491 errors:0 dropped:0 overruns:0 frame:0
TX packets:333825895 errors:0 dropped:0 overruns:0 carrier:0
collisions:0 txqueuelen:1000
RX bytes:92667389749 (86.3 GiB) TX bytes:93365772607 (86.9 GiB)

eth1:hap-clnp Link encap:Ethernet HWaddr 00:50:56:9E:3C:9C
inet addr:10.0.0.12 Bcast:10.254.1.52 Mask:255.255.255.255
UP BROADCAST RUNNING MULTICAST MTU:1500 Metric:1

eth1:hap-ncnp Link encap:Ethernet HWaddr 00:50:56:9E:3C:9C
inet addr:10.0.0.11 Bcast:10.254.1.51 Mask:255.255.255.255
UP BROADCAST RUNNING MULTICAST MTU:1500 Metric:1

eth1:nginx-clnp Link encap:Ethernet HWaddr 00:50:56:9E:3C:9C
inet addr:10.0.0.13 Bcast:10.254.1.32 Mask:255.255.255.255
UP BROADCAST RUNNING MULTICAST MTU:1500 Metric:1

eth1:nginx-ncnp Link encap:Ethernet HWaddr 00:50:56:9E:3C:9C
inet addr:10.0.0.14 Bcast:10.254.1.30 Mask:255.255.255.255
UP BROADCAST RUNNING MULTICAST MTU:1500 Metric:1

lo Link encap:Local Loopback
inet addr:127.0.0.1 Mask:255.0.0.0
inet6 addr: ::1/128 Scope:Host
UP LOOPBACK RUNNING MTU:16436 Metric:1
RX packets:4073 errors:0 dropped:0 overruns:0 frame:0
TX packets:4073 errors:0 dropped:0 overruns:0 carrier:0
collisions:0 txqueuelen:0
RX bytes:1136055 (1.0 MiB) TX bytes:1136055 (1.0 MiB)

Much better this way :)

More info here: http://linux.die.net/man/7/ocf_heartbeat_ipaddr2

Installing graphite 0.9.10 on debian squeeze

The graphing system I like the most is graphite. It’s very useful for a lot of things (fast, scalable, low resources consuming, etc, etc). Today I’ll explain how to install graphite 0.9.10 on Debian squeeze.

First of all, we install the requirements:

apt-get install python apache2 python-twisted python-memcache libapache2-mod-python python-django libpixman-1-0 python-cairo python-django-tagging

And then we make sure we don’t have installed whisper from debian’s repository, which is old and may have incompatibilities with the last version of graphite:

apt-get remove python-whisper

Then we install the application. I’ve build some .deb packages that can be used directly:

wget http://www.tomas.cat/blog/sites/default/files/python-carbon_0.9.10_all.deb
wget http://www.tomas.cat/blog/sites/default/files/python-graphite-web_0.9.10_all.deb
wget http://www.tomas.cat/blog/sites/default/files/python-whisper_0.9.10_all.deb
dpkg -i python-carbon_0.9.10_all.deb python-graphite-web_0.9.10_all.deb python-whisper_0.9.10_all.deb

But if you don’t like mine, it’s ease to make them yourself with fpm (Effing package managers), a ruby app to build packages for different package managers. First we install ruby and fpm:

apt-get install ruby rubygems
gem install fpm

Then we download graphite and we untar it:

wget http://pypi.python.org/packages/source/c/carbon/carbon-0.9.10.tar.gz#md5=1d85d91fe220ec69c0db3037359b691a
wget http://pypi.python.org/packages/source/w/whisper/whisper-0.9.10.tar.gz#md5=218aadafcc0a606f269b1b91b42bde3f
wget http://pypi.python.org/packages/source/g/graphite-web/graphite-web-0.9.10.tar.gz#md5=b6d743a254d208874ceeff0a53e825c1
tar zxf graphite-web-0.9.10.tar.gz
tar zxf carbon-0.9.10.tar.gz
tar zxf whisper-0.9.10.tar.gz

Finally we build the packages and install them:

/var/lib/gems/1.8/gems/fpm-0.4.22/bin/fpm --python-install-bin /opt/graphite/bin -s python -t deb carbon-0.9.10/setup.py
/var/lib/gems/1.8/gems/fpm-0.4.22/bin/fpm --python-install-bin /opt/graphite/bin -s python -t deb whisper-0.9.10/setup.py
/var/lib/gems/1.8/gems/fpm-0.4.22/bin/fpm --python-install-lib /opt/graphite/webapp -s python -t deb graphite-web-0.9.10/setup.py
dpkg -i python-carbon_0.9.10_all.deb python-graphite-web_0.9.10_all.deb python-whisper_0.9.10_all.deb

We have graphite app installed. Whisper doesn’t need any configuration.Carbon does, but we can go with the default config files:

cp /opt/graphite/conf/carbon.conf.example /opt/graphite/conf/carbon.conf
cp /opt/graphite/conf/storage-schemas.conf.example /opt/graphite/conf/storage-schemas.conf

This storache-schemas.conf stores data every minute for a day. As it’s very likely that we need to store data longer (a month, a year…), my storache-schemas.conf looks like that:

[default_1min_for_1month_15min_for_2years]
pattern = .*
retentions = 60s:30d,15m:2y

This way data is stored every minute for 30 days, and every 15 minutes for 2 years. This makes each graph data size 1,4MB, something reasonable. You can play with these numbers if you need more time or you want to store less space on disk (it’s pretty intuitive).

After that we need to initialize the database:

cd /opt/graphite/webapp/graphite
sudo python manage.py syncdb

And now we could start carbon to begin to collect data, executing:

cd /opt/graphite/
./bin/carbon-cache.py start

But we also want the service to start with the machine, so we need to add it to init.d. As there is no init file with the application, I downloaded an init.d file for graphite in RedHat, and I did little changes to make it work in Debian:

#!/bin/bash
#
# Carbon (part of Graphite)
#
# chkconfig: 3 50 50
# description: Carbon init.d

. /lib/lsb/init-functions
prog=carbon
RETVAL=0

start() {
log_progress_msg "Starting $prog: "

PYTHONPATH=/usr/local/lib/python2.6/dist-packages/ /opt/graphite/bin/carbon-cache.py start
status=$?
log_end_msg $status
}

stop() {
log_progress_msg "Stopping $prog: "

PYTHONPATH=/usr/local/lib/python2.6/dist-packages/ /opt/graphite/bin/carbon-cache.py stop > /dev/null 2>&1
status=$?
log_end_msg $status
}

# See how we were called.
case "$1" in
start)
start
;;
stop)
stop
;;
status)
PYTHONPATH=/usr/local/lib/python2.6/dist-packages/ /opt/graphite/bin/carbon-cache.py status
RETVAL=$?
;;
restart)
stop
start
;;
*)
echo $"Usage: $prog {start|stop|restart|status}"
exit 1
esac

exit $RETVAL

To install it we just need to put it where it belongs:

wget http://www.tomas.cat/blog/sites/default/files/carbon.initd -O /etc/init.d/carbon
chmod 0755 /etc/init.d/carbon
chkconfig --add carbon

Now we can start it from initd (service carbon start or also /etc/init.d/carbon start). Finally, we configure the webapp to access the data. We create an apache virtualhost with this content:


ServerName YOUR_SERVERNAME_HERE
DocumentRoot "/opt/graphite/webapp"
ErrorLog /opt/graphite/storage/log/webapp/error.log
CustomLog /opt/graphite/storage/log/webapp/access.log common


SetHandler python-program
PythonPath "['/opt/graphite/webapp'] + sys.path"
PythonHandler django.core.handlers.modpython
SetEnv DJANGO_SETTINGS_MODULE graphite.settings
PythonDebug Off
PythonAutoReload Off

Alias /content/ /opt/graphite/webapp/content/

SetHandler None


We add the virtualhost and allow apache user to access whisper data:

wget http://www.tomas.cat/blog/sites/default/files/graphite-vhost.txt -O /etc/apache2/sites-available/graphite
a2ensite graphite
chown -R www-data:www-data /opt/graphite/storage/
/etc/init.d/apache reload

And that’s it! One last detail… graphite comes with Los Angeles timezone. In order to chang it, we need to set “TIME_ZONE” variable in /opt/graphite/webapp/graphite/local_settings.py file. There is a file with lots of variables in /opt/graphite/webapp/graphite/local_settings.py.example, but as I just need to change the timezone, I run this command:

echo "TIME_ZONE = 'Europe/Madrid'" > /opt/graphite/webapp/graphite/local_settings.py

And with that we have everything. Now we just need to send data to carbon (port 2003) to be stored in whisper si graphite webapp can show it. Have fun!

Bibliography: I’ve followed official documentation http://graphite.wikidot.com/installation and http://graphite.wikidot.com/quickstart-guide, but debian specifics were at http://slacklabs.be/2012/04/05/Installing-graphite-on-debian/